
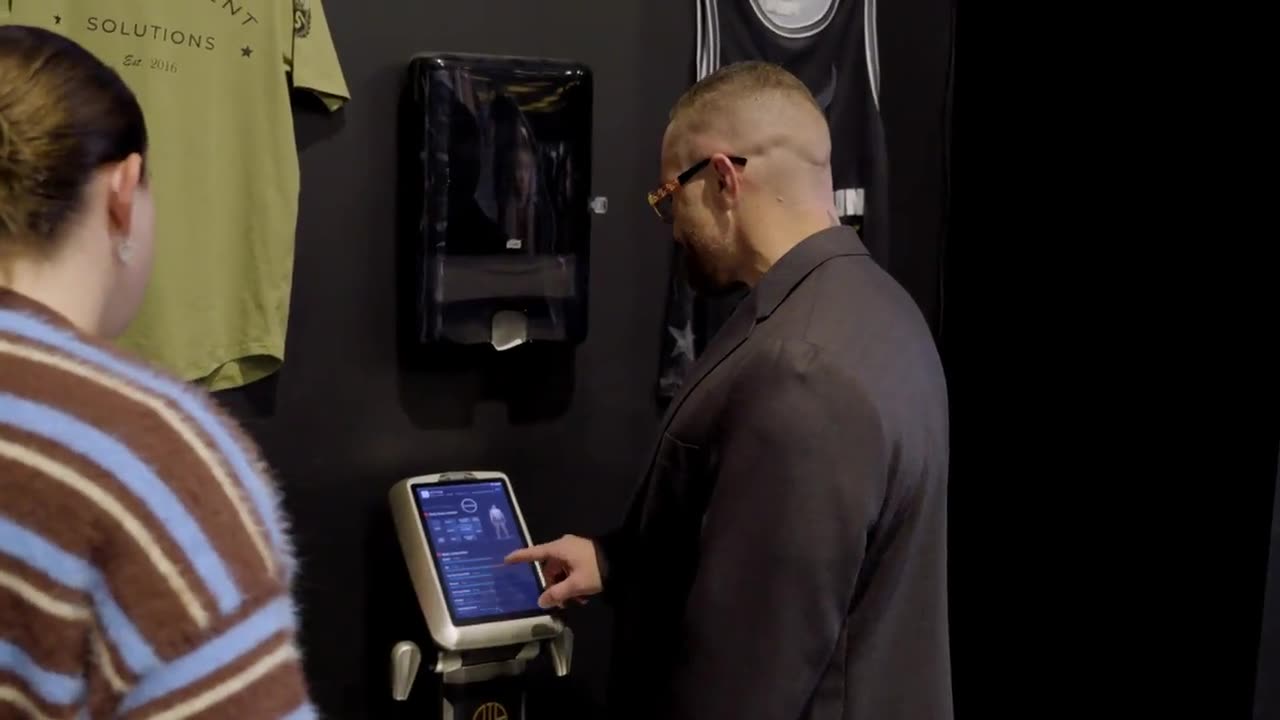
Body composition data.
Available BIA reports estimate fat, lean mass and body water. Outputs and accuracy vary by device. A visceral-fat index and calculated metabolic rate are estimates, not direct measurements. [1] [2]
The programme brings together your food intake, training, lifestyle and available measurements to build a plan around your goals.
A structured review turns those inputs into practical changes. The plan is then adjusted using your progress and feedback, rather than treating its starting targets as fixed.
We review six areas to understand your starting point. What we can assess depends on the information you provide; scans and blood results are used where available.
Available BIA reports estimate fat, lean mass and body water. Outputs and accuracy vary by device. A visceral-fat index and calculated metabolic rate are estimates, not direct measurements. [1] [2]
A multi-day food log helps estimate energy, protein, carbohydrate, fat, fibre and micronutrient intake. We also review meal timing and food choices. Estimates depend on the detail recorded.
Current programme, equipment, history, injuries, recovery capacity. We design around what you can actually do.
Sleep, stress, occupation, training load and recovery patterns. These help us judge whether the plan fits your day-to-day life.
Where appropriate, in coordination with your GP. Existing conditions and medications shape what fits and what does not.
Where you provide it. Lipids, fasting insulin, ApoB, inflammatory markers, hormones. We do not order labs.
Scale weight vs the scan
In Matt's words
Weight alone does not show which tissues changed. BIA adds estimates, but a small change in its readings is not proof of fat loss or muscle gain. Matt explains the difference.
We review changes in your recorded intake, training, weight and available measurements alongside your feedback. Food-model scores are estimates, not clinical test results.
The published DII estimates a diet's inflammatory potential. It does not measure your inflammation or identify its cause. [3]
We consider caffeine, meal timing, sleep and training load together. Concerns about abnormal cortisol need clinical assessment, not a food score. [6]
Cycle phase, symptoms, medicines and existing results can inform the discussion. Persistent symptoms or abnormal hormone results belong with your GP.
Six-, twelve- and eighteen-week points are opportunities to review training, available measurements and progress. They are checkpoints, not forecasts.
A visceral-fat index adds context but does not directly track abdominal fat. We consider it alongside other information, without promising selective fat loss. [2]
Suitable protein intake, resistance training and recovery can support lean mass during an energy deficit. The aim is preservation, not a guaranteed result. [7]
The framework brings food intake, training, recovery and health context together. Its role is to organise information for coaching decisions, not diagnose conditions or predict an individual outcome.
Computational analysis helps organise the information for an initial review. Matt reviews the findings and sets the nutrition plan; the software does not replace that judgement.
Switch meals to compare ingredients, serving estimates and practical options. The eight topics explain what those details can tell you, without predicting your biomarkers.
Compare ingredients and serving estimates, then explore the questions each topic raises. These examples are not measured responses, safety ratings or predictions.
What carbohydrate foods and portions are included?
95 g carbohydrate in this example
A meal's ingredients do not reveal your blood glucose concentration. Individual responses vary.
Explore glucoseHow do carbohydrate amount and food choice compare?
95 g carbohydrate in this example
Glycaemic load uses GI and available carbohydrate. It is a dietary estimate, not a blood test.
Explore glycaemic loadWhere do fruit, vegetables, grains and fats fit across your week?
3 g fibre in this example
A dietary pattern can be assessed over time. One meal does not provide an inflammatory blood-marker reading.
Explore dietary inflammatory potentialHow varied are the protein foods and plant foods?
18 g protein in this example
PRAL estimates dietary acid load. It does not measure kidney damage or mean a food changes your blood pH.
Explore dietary acid loadDoes the meal timing fit your work, sleep and training?
Consider the whole day, not one meal
Food and caffeine habits can be discussed without assigning a cortisol score. Hormone concerns need clinical assessment.
Explore stress and recoveryWhich fibre-containing foods are included, and do they suit you?
3 g fibre in this example
Fibre types and individual tolerance matter. A meal description cannot tell us your short-chain fatty acid concentration.
Explore fibre and gut healthDoes this meal fit your overall intake and activity?
720 kcal in this example
Energy and nutrient estimates help with meal planning. They do not diagnose insulin resistance or predict blood fats.
Explore energy and metabolic healthIs your overall eating pattern adequate for your needs?
Consider the whole day, not one meal
Assess symptoms and life stage alongside clinical care. No single meal can be scored as balancing your hormones.
Explore hormonal health contextChange the meal slot or example above. Tap a card for context, or follow its link for the full explanation.
A sandwich lunch with crisps, a drink and a cookie. Filling, bread and portions can vary substantially.
Try this: Try a wholegrain sandwich with egg or tofu and vegetables, with fruit alongside.
Illustrative meal nutrients
720 kcal
Serving estimates, not verified product-label values. Bars share a 0–150 g scale, not a target or health score. Ingredients, brands and portions change the figures.
Dietary concepts have specific limits. For example, PRAL estimates dietary acid load, not kidney damage or blood acidity. [8]
Each of the eight factors has a dedicated page explaining the topic and how it informs your report. Research on an individual factor does not, by itself, validate the combined scoring model.
Cross-sectional testing of three smart scales in a clinical sample. It does not establish the accuracy of every scanner or wearable, or validate long-term change detection.
Manufacturer documentation, not independent validation. Used for output definitions, not promotional claims of diagnostic accuracy.
Does not validate Inception's implementation, diagnose inflammation or provide a post-meal IL-6 time course.
University of Sydney GI guidance. The calculation is not an individual glucose measurement or a complete mixed-meal response model.
PREDICT 1 studied its own measurements and prediction methods. Its findings do not validate Inception's curves, safety bands or claimed coaching outcomes.
Guidance about Cushing's syndrome, not ordinary stress or a validation study of dietary cortisol scoring.
Four-week proof-of-principle trial in 40 young men undertaking intensive exercise. Lean body mass was measured, not skeletal muscle directly; results are not a universal guarantee.
Does not establish a universal meal-safety threshold or measure kidney damage, strain or an individual's real-time response.
The free metabolic audit uses your answers to suggest coaching priorities. No commitment, and no medical diagnosis. Explore the programmes when you are ready.
Get your personalised report.